


 Robert Dobrowsky
Converting Your Assets to Cash—How Does Your Company Stack Up?
September 1, 2011Comments
“Cash is king.” This common phrase captures the feelings of many manufactures I have worked with over the years. Companies with strong cash positions are able to invest further into their businesses or pay down existing debt. In addition to these obvious benefits, a strong cash position also can provide a business owner the peace of mind needed to sleep better at night.
Companies can measure how well they convert their assets to cash by maintaining certain activity ratios to compare themselves against past performance and the performance of others in the metalforming industry. To benchmark performance in this area, the annual PMA Benchmarking Report collects data on two of the more important activity ratios: the average collection period for accounts receivables, and the inventory-conversion period.
Average Collection Period
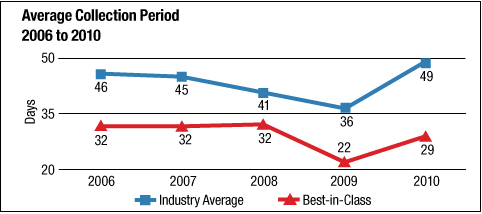
This ratio, also known as days sales outstanding (DSO), measures how long it takes for a company to collect its outstanding accounts receivables and convert them into cash. From 2006 to 2009, the average collection period trended downward to a low of 36 days in 2009. During the economic downturn, companies tightened their collection procedures, further reducing DSO. This trend abruptly ended in 2010, as efforts were relaxed and the collection period spiked up to 49 days, its highest point since 2006.
Best-in-class performance relating to this ratio ranged from a low of 22 days in 2009 to a high of 32 days in 2007. In 2010, best-in-class performance meant companies collected receivables 20 days faster than average performance.
Inventory Conversion Period
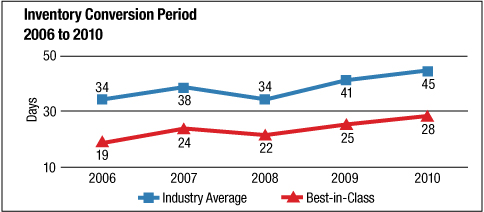
 The inventory conversion period represents the amount of time required to obtain materials from a supplier, manufacture the product and sell it to a customer—the amount of time a company must invest its cash while it manufactures the product and converts it into a sale. The average conversion period has increased steadily from a low of 34 days in 2006 to a high of 45 days in 2010. Best-in-class performance here also had a steady incline from a low of 19 days in 2006 to a high of 28 days in 2010.
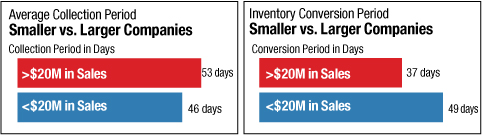
Benchmark Against Similar Companies
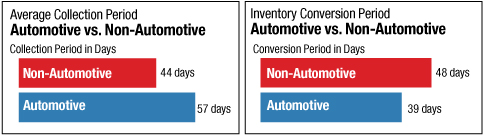
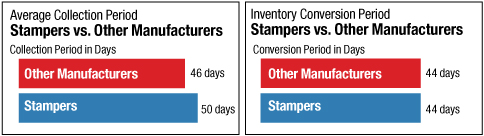
 In addition to reporting the industry average and best-in-class performance for the entire population of participants, the PMA Benchmarking Report issues breakout reports that further dissect the information into several different categories, such as industry served (automotive, aerospace, appliance, medical, etc.), company size (based on net sales and number of employees), and type of manufacturer—stamping, fabricating, slideforming, etc. These breakout reports allow companies to benchmark themselves against companies with similar characteristics. Below is a look at the 2010 data for three of these distinct categories.

 Podcast
 Webinar