Selecting the FLC for Simulation
One goal of new-product development: All forming strains lie below the sheet metal’s forming limit. Selecting an FLC is a critical step when conducting a computer-based forming simulation as part of this process. Steel and aluminum producers supply simulation-software providers with alloy-specific data to incorporate into the material cards shown in their database libraries. Select the appropriate card if you know the source of the alloy. Some choices might be shown as the trademarked name of a particular alloy. Select that option only if that is what you are using. Understand that different suppliers do not produce advanced alloys in the same way. By extension, such materials can behave differently when formed.
Proper simulation becomes more challenging when the material producer has not provided a material card, or worse yet, the producer is unknown. Avoid selecting a product shown only by a generic description, such as 6XXX aluminum. Not only does this ignore the forming differences between suppliers, but it does not factor in the effects of temper—T4, T6 and T82, for example.A particular danger stems from the ease of use of most simulation programs. Most provide the option of inputting the n-value and thickness, and the software calculates the FLC. It’s a great option—but only when using mild steel or conventional high-strength steel. For other alloys, this shortcut will produce inaccurate results.
The Shape of the FLC
The shape of the FLC, consistent among mild steel and conventional high-strength-steel grades, takes the general shape of a checkmark. The left-hand side features a slope of -1 in true-strain space, while the right-hand side exhibits a slope of about +0.6. FLC0, defined as the lowest point on the FLC, typically occurs near where the minor strain is 0. The value of FLC0 determines the location where the FLC is plotted on the graph.
Based on empirical data collected by Dr. Keeler, FLC0 for mild and conventional high-strength steels is a function only of the sheet metal thickness before forming and the n-value (strain-hardening exponent), calculated as:
FLC0 = (23.3+360t) x (n/0.21)
where t represents the sheet thickness in inches, and n refers to the n-value, or:
FLC0 = (23.3+14.2t) x (n/0.21)
where t represents the sheet thickness in millimeters, and n refers to the n-value. N-value has a larger effect than thickness, and both increase FLC0, which, in turn, is reflected in greater formability.
The shape and placement of the FLC for most other materials, including aluminum alloys, stainless steels and some advanced high-strength steels, cannot be represented by a simple curve or a universally applicable equation. For these products, a curve must be established for each grade and thickness combination. The method used to generate the FLC influences the results, so care must be taken when applying it to your analysis. These curves can be generated in several ways, including the international standard ISO 12004—Determination of Forming Limit Curves in the Press Shop (Part 1) and in the Laboratory (Part 2).
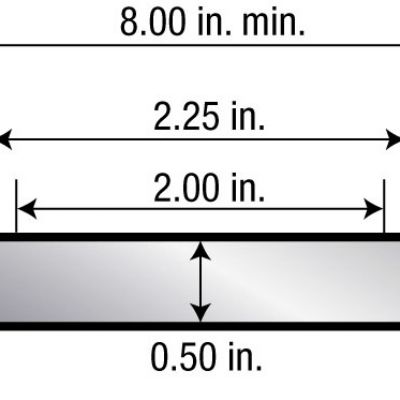
The properties and condition of the subject sheet metal also influences the FLC. In addition to tensile properties, other common influences on the curve include the sheet metal surface profile, the chosen lubricant and the testing temperature. Although collecting the data for these curves at a strain rate typically seen in a tensile test is easier, manufacturing a production stamping results in a strain rate 1000 times greater. Select the test parameters for FLC generation to best replicate the conditions used in the manufacture of your part.
Incorporating the wrong FLC into an analysis may lead to overdesign and unnecessary cost, or to building stamping tools that cannot consistently produce good parts.
Want to learn more about different sheet metals and formability? Plan to attend PMA’s Sheetmetal Formability of Steel, Aluminum and Stainless Steels seminar in Grand Rapids, MI, June 11-12. To register, visit www.pma.org or contact Marianne Sichi, for information. MF
See also: Engineering Quality Solutions, Inc., 4M Partners, LLC
Technologies: Quality Control


 Daniel Schaeffler
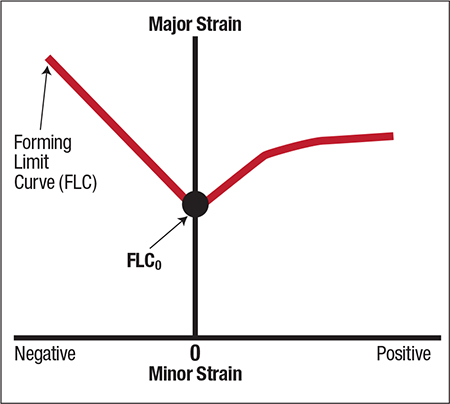

 Video
Video