


 Eren Billur
Digital Image Correlation for Creating FLCs
June 1, 2020Comments
The forming limit curve (FLC) has been a key problem solver in the metal forming industry since the 1960s. Developed by the late Dr. Stuart Keeler, formerly the author of the Science of Forming column for MetalForming magazine, stampers use the FLC during tool development and production-problem analysis. However, most users do not understand the origin and variables that influence the shape and placement of the curve.
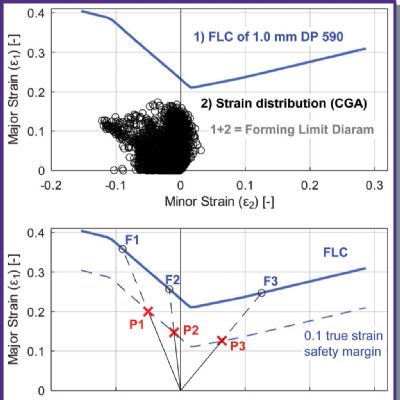
 Unfortunately, often we see the terms FLC and FLD (forming limit diagram) incorrectly used interchangeably. Fig. 1 displays their differences.
FLC changes with material type and thickness, and with the material supplier. It also can change from coil to coil and batch to batch, and even within the same coil. In addition, different test methods can result in different FLCs.
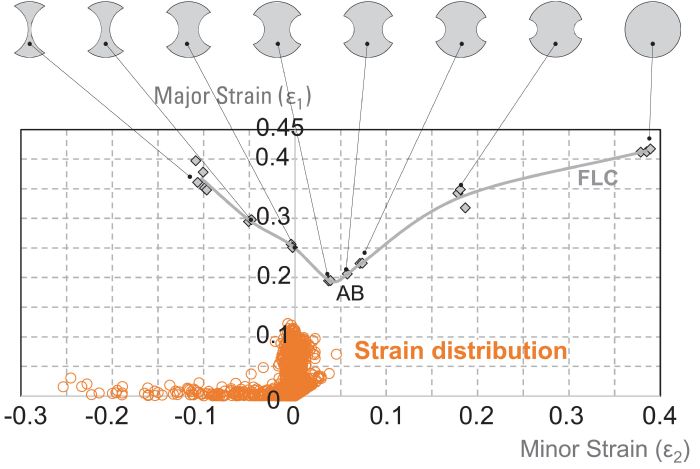
Strain distribution depends on the material and the forming process. To measure strain distributions, we apply a grid before deforming the part. As Keeler pointed out, circle grids are easier to analyze, as their orientation simply gives the principal strains. Note: For additional information on circle-grid analysis, visit www.metalformingmagazine.com/article/?/quality-control/cmms-scanning-systems-camera-systems-others/introduction-to-strain-analysis-measuring-strains.
After stamping a part, the circles on the grid may become ellipses, or circles with different radii. By calculating the percentage elongations with respect to the original circle diameters, we can calculate strain distribution. Then, knowing the strain distributions on the stamped part and the FLC of the incoming material, we can evaluate forming severity, how close the process is to failure, and the process robustness relative to the material’s forming limits.
Determining FLC
 While FLC theory originated during the 1960s, no standards existed until 2002, which saw the publication of ASTM E2218, Standard Test Method for Determining Forming Limit Curves. In 2008, ISO published ISO 12004—Metallic materials—Sheet and strip—Determination of forming-limit curves—Part 2: Determination of forming-limit curves in the laboratory.
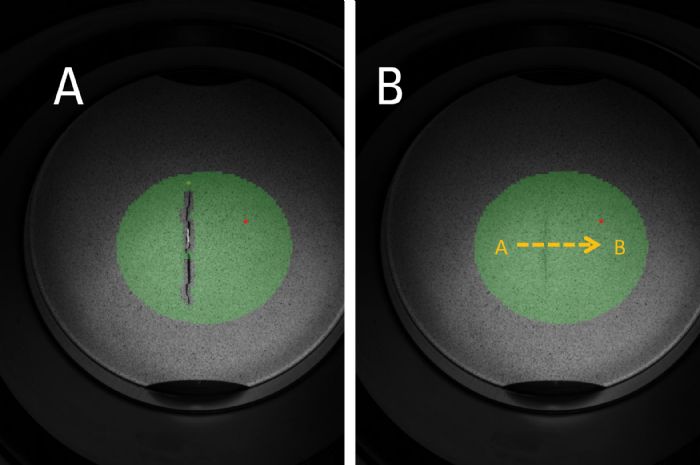
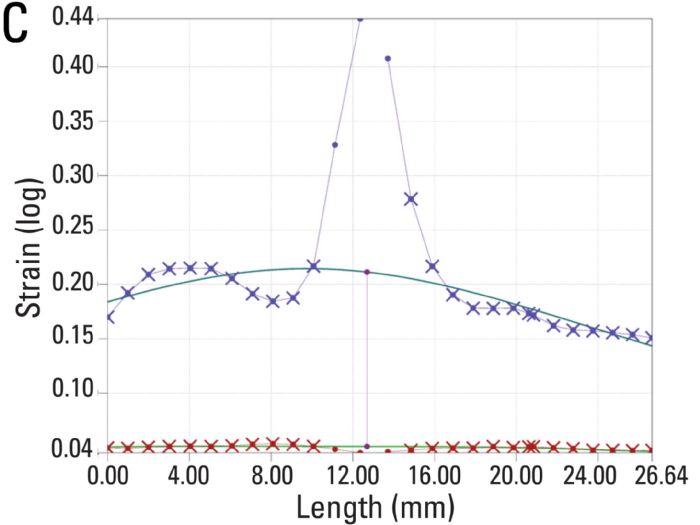 In the past, those conducting the test would try to sense necking of the specimen using their fingers. Once they sensed necking, they would manually measure the strain distribution on that section. Now, noncontact optical DIC systems can sense the onset of necking and then measure strain distribution. The operator can set the DIC system to take photographs of the test specimen at given time increments (at least 10 photos/sec., according to ISO 12004-2008) from the time the punch starts to deform the sheet metal until after a crack forms (Fig. 2A).