
Page 20 - MetalForming May 2010
P. 20
Adding
Capacity Rate
to the OEE Equation
Managing a stamping department has become more difficult than ever. As auto production has plummeted, we (automotive-parts sup- plier F&P America) have been faced with significant profitability pressures that have forced us to increase efforts to reduce waste. While past practices were sound and enabled us to find and solve many issues, we’ve elevated our efforts to take waste reduction to the next level. That has meant identifying and solving even the smallest of issues.
Our solution was to brainstorm and develop an internal OEE (overall equip- ment effectiveness) tracking system that allowed us to identify the key compo- nents of OEE: performance rate (PR), quality rate (QR) and operating rate (OR). The key goals of the tracking sys- tem were:
• Eliminate production sheets;
• Support web-based local and near- real-time input by operators;
• Provide standard visual graphs/ reports; and
• Provide OEE details (OR, PR and QR).
To ensure that the new OEE tracking system would be used and prove effec- tive, a team of associates, team leaders and supervisors worked together to guide its creation. The system was launched early in 2009.
Shawn Murphy is a supplier development engineer for Honda Manufacturing, Marys- ville, OH; Shawn_Murphy@ham.honda.com. Bill Blain is stamping department super- visor, F&P America.
To support its supplier, F&P America, Honda’s North American Technical Group developed a new equation for measuring overall equipment effectiveness, and testifies that effective problem solving starts with a strong data-collection system.
BY SHAWN MURPHY AND BILL BLAIN
Creating an Effective Visual Output
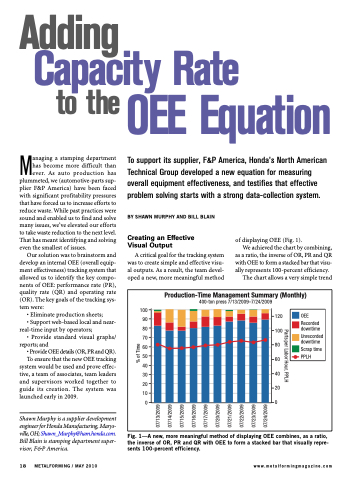
A critical goal for the tracking system was to create simple and effective visu- al outputs. As a result, the team devel- oped a new, more meaningful method
of displaying OEE (Fig. 1).
We achieved the chart by combining,
as a ratio, the inverse of OR, PR and QR with OEE to form a stacked bar that visu- ally represents 100-percent efficiency.
The chart allows a very simple trend
Production-Time Management Summary (Monthly)
400-ton press 7/13/2009–7/24/2009
120 OEE
Recorded 80 100 downtime
Unrecorded downtime
Scrap time
100 90
70
60
50 60 PPLH 40
30
20
10
00
80
40 20
18 METALFORMING / MAY 2010
www.metalformingmagazine.com
Fig. 1—A new, more meaningful method of displaying OEE combines, as a ratio, the inverse of OR, PR and QR with OEE to form a stacked bar that visually repre- sents 100-percent efficiency.
Parts per Labor Hour, PPLH
07/13/2009 07/14/2009 07/15/2009 07/16/2009 07/17/2009 07/20/2009 07/21/2009 07/22/2009 07/23/2009 07/24/2009
% of Time
