
Page 21 - MetalForming May 2010
P. 21
160
151
12-Week History of Downtime Minutes (Weekly Total)
160-ton press
146
140 120 100
80 60 40 20
0
19
22
13
3
121
84
79
Corrective action taken
Plant shutdown period
analysis of PR, OR, QR and OEE over days, weeks or months. Its simplicity makes it easy for all associates to under- stand. Other benefits with the system include standardized and consistent detailed downtime codes, a variety of graphs to support trend analysis, and pareto charts to show critical down- time items.
F&P America spent several months fine-tuning the system, training opera- tors and developing the methodology for using this information to improve overall OEE.
The stamping department had expe- rience with OEE and so associates quickly learned to use each component. Initial PR calculations identified lost time in excess of 20 percent, larger than expected, and press operators were asked to identify the reasons for so much lost time. We developed and implemented OEE training programs for the operators, and they were tasked with recording all downtime and with reducing lost time. Asking the operators to identify the reasons for lost time, we found, increased their awareness of and their contribution to avoiding lost time. These initial efforts resulted in a mod- est reduction in lost time.
To make more of an impact, we decided to outfit the presses to allow us to electronically log press operations
and to track stoppages. Operators then could use this information to identify all downtime. We wired a stopwatch-type device into the PLC of the presses that would run any time that a press stopped. These stoppages were displayed for each operator to see and use when entering downtime into the OEE system at each press. The result was a lost-time reduction of 2 to 3 percent, and
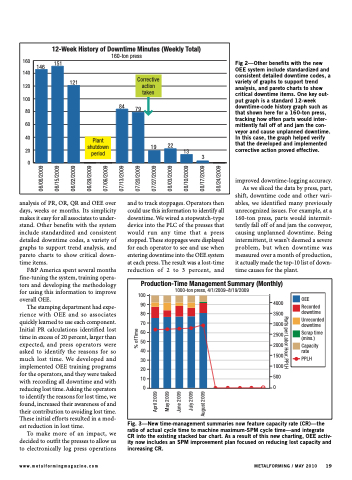
Fig 2—Other benefits with the new OEE system include standardized and consistent detailed downtime codes, a variety of graphs to support trend analysis, and pareto charts to show critical downtime items. One key out- put graph is a standard 12-week downtime-code history graph such as that shown here for a 160-ton press, tracking how often parts would inter- mittently fall off of and jam the con- veyor and cause unplanned downtime. In this case, the graph helped verify that the developed and implemented corrective action proved effective.
improved downtime-logging accuracy. As we sliced the data by press, part, shift, downtime code and other vari- ables, we identified many previously unrecognized issues. For example, at a 160-ton press, parts would intermit- tently fall off of and jam the conveyor, causing unplanned downtime. Being intermittent, it wasn’t deemed a severe problem, but when downtime was measured over a month of production, it actually made the top-10 list of down-
time causes for the plant.
Production-Time Management Summary (Monthly)
1000-ton press, 4/1/2009–8/19/2009
100
90
80
70
60
50
40
30
20
10
OEE 4000
3500
3000
2500
2000 Capacity
Recorded downtime
Unrecorded downtime
Scrap time (mins.)
00
1500 1000 500
rate PPLH
www.metalformingmagazine.com
METALFORMING / MAY 2010 19
Fig. 3—New time-management summaries now feature capacity rate (CR)—the ratio of actual cycle time to machine maximum-SPM cycle time—and integrate CR into the existing stacked bar chart. As a result of this new charting, OEE activ- ity now includes an SPM improvement plan focused on reducing lost capacity and increasing CR.
Parts per Labor Hour, PPLH
April 2009 May 2009 June 2009 July 2009 August 2009
% of Time
06/08/2009 06/15/2009 06/22/2009 06/29/2009 07/06/2009 07/13/2009 07/20/2009 07/27/2009 08/03/2009 08/10/2009 08/17/2009 08/24/2009
