
Page 22 - MetalForming May 2010
P. 22
Adding Capacity Rate to the OEE Equation
QR
CR
OEE (OR*PR*QR*CR)
Rate
76.7%
97.1%
85.1%
56.7%
Actual OEE Data
1–Rate
23.3%
2.9%
14.9%
56.7%
B
A
Chart Data
(1–Rate) *A/B
OR
PR
89.5%
10.5%
36.8%
28.4%
8.1%
18.0%
2.3%
14.9%
56.7%
Recorded downtime %
Unrecorded downtime %
Scrap %
Lost capacity %
OEE
108.3%
100.0%
One key output graph we designed was a standard 12-week downtime-code history graph. This graph (Fig. 2) allows anyone in the plant to review the trend of a particular downtime. In this case, we used the graph to verify that the developed and implemented corrective action proved effective.
A New Measure: Capacity Rate
At some point, the ability to increase OEE starts to become limited by fixed downtime events such as coils changes and die changes, and a certain amount of random downtime events. Of course, that didn’t stop F&P America’s president from pushing for more cost and man- power reductions. That pressure led us to reevaluate the press stroke rate for our dies, taking a close look at run rate based on die size, steel thickness and other variables. Initially, we judged OEE against a defined part-specific press rate, not against a press’s maximum stroke rate.
Consider, for example, a 1000-ton press with a manufacturer’s rating of 60 strokes/min (SPM). Since not all parts can run at 60 SPM, we essentially have lost capacity (similar to lost time relat- ed to PR). So, a part running at 45 SPM has 25-percent lost capacity. Note also that increasing SPM from 45 to 60 rep- resents a 33-percent increase. That is a significant capacity boost, and you get it for free.
Taking all of this into consideration, we needed a way to mathematically capture this on a part-by-part basis. The first solution was to simply change all of the cycle times in the system to be based on 60 SPM. While that does work, in the traditional OEE formula that loss shows up as PR (lost time). For exam- ple, if the 45-SPM part had 3-percent lost time before the change, after the change it would be around 28 percent. When that happens, the associates can no longer use PR as a measuring stick and the actual lost time creeps up.
With brainstorming, we were able to isolate this factor by calculating the ratio of actual cycle time to machine
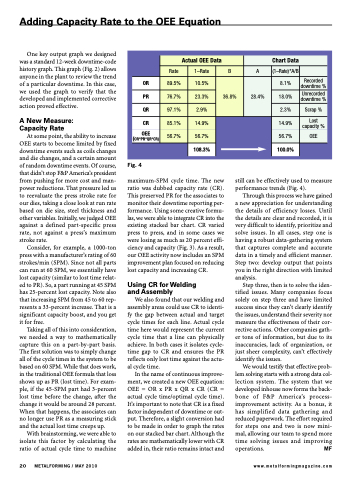
Fig. 4
maximum-SPM cycle time. The new ratio was dubbed capacity rate (CR). This preserved PR for the associates to monitor their downtime reporting per- formance. Using some creative formu- las, we were able to integrate CR into the existing stacked bar chart. CR varied press to press, and in some cases we were losing as much as 20 percent effi- ciency and capacity (Fig. 3). As a result, our OEE activity now includes an SPM improvement plan focused on reducing lost capacity and increasing CR.
Using CR for Welding and Assembly
We also found that our welding and assembly areas could use CR to identi- fy the gap between actual and target cycle times for each line. Actual cycle time here would represent the current cycle time that a line can physically achieve. In both cases it isolates cycle- time gap to CR and ensures the PR reflects only lost time against the actu- al cycle time.
In the name of continuous improve- ment, we created a new OEE equation: OEE=ORxPRxQRxCR(CR= actual cycle time/optimal cycle time). It’s important to note that CR is a fixed factor independent of downtime or out- put. Therefore, a slight conversion had to be made in order to graph the rates on our stacked bar chart. Although the rates are mathematically lower with CR added in, their ratio remains intact and
still can be effectively used to measure performance trends (Fig. 4).
Through this process we have gained a new appreciation for understanding the details of efficiency losses. Until the details are clear and recorded, it is very difficult to identify, prioritize and solve issues. In all cases, step one is having a robust data-gathering system that captures complete and accurate data in a timely and efficient manner. Step two: develop output that points you in the right direction with limited analysis.
Step three, then is to solve the iden- tified issues. Many companies focus solely on step three and have limited success since they can’t clearly identify the issues, understand their severity nor measure the effectiveness of their cor- rective actions. Other companies gath- er tons of information, but due to its inaccuracies, lack of organization, or just sheer complexity, can’t effectively identify the issues.
We would testify that effective prob- lem solving starts with a strong data col- lection system. The system that we developed inhouse now forms the back- bone of F&P America’s process- improvement activity. As a bonus, it has simplified data gathering and reduced paperwork. The effort required for steps one and two is now mini- mal, allowing our team to spend more time solving issues and improving operations. MF
20 METALFORMING / MAY 2010
www.metalformingmagazine.com
