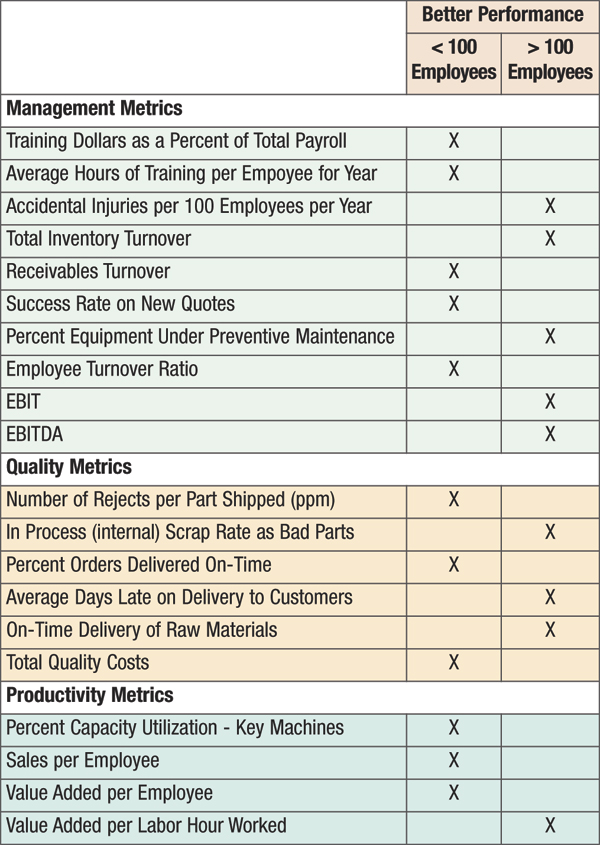
Management Metrics
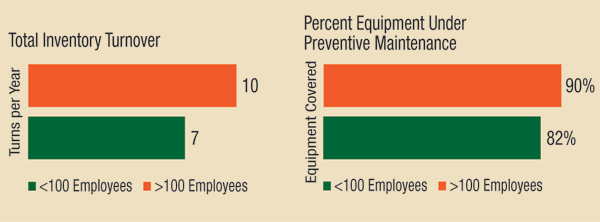 |
Fig. 3
|
Where did companies with fewer than 100 employees perform better? Our survey finds small companies excel in the metrics relating to training, receivables turnover, success rate on new quotes and employee turnover.
For example, smaller companies invested more in their employees, spending 0.86 percent of total payroll dollars on training compared to 0.69 percent invested by larger companies. These same companies provided employees an additional 4.0 hr. of training on an annual basis (29 hr. on average, per employee) over what larger companies provided their employees.
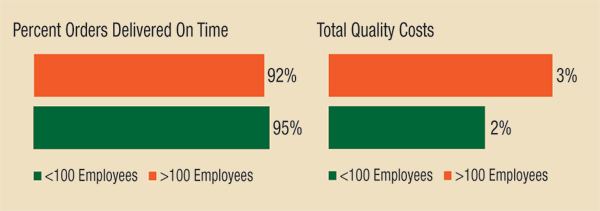 |
Fig. 4
|
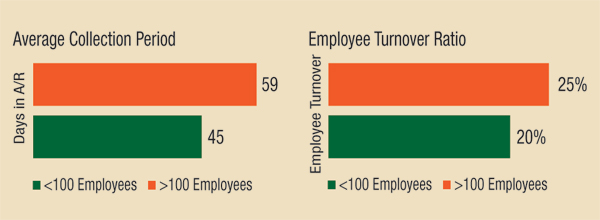
Receivables turnover was higher for smaller companies, where accounts receivables were collected in 45 days on average. Companies with more than 100 employees took two additional weeks to collect their accounts receivable, with an average collection period of 59 days. Smaller companies also experienced lower employee turnover—20 percent, compared to larger companies at 25 percent (Fig. 2).
Larger companies scored higher in safety, inventory turnover, equipment under preventive maintenance and profitability. Relating to safety, larger companies averaged approximately five accidental injuries per 100 employees per year, compared to seven for smaller companies. Larger companies turned inventory 10 times/yr., three more than the seven inventory turns/yr. for smaller companies. Finally, while smaller companies had only 82 percent of their equipment under an active preventive-maintenance plan, larger companies covered closer to 90 percent (Fig. 3).
Quality Metrics
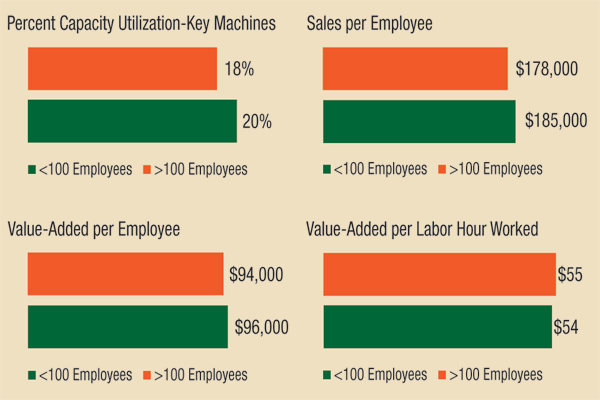 |
Fig. 5
|
In terms of quality, smaller companies outperformed larger ones in the number of rejects, on-time delivery rates, and total cost of quality. Larger companies did better at internal scrap rate, average days late to customers, and supplier on-time delivery rates of raw materials.
Specifically, with respect to on-time delivery rates to customers, small companies averaged 95 percent, while the larger companies averaged 92 percent. Relating to total cost of quality, smaller companies spent more efficiently, with an average spend of 2 percent of sales, while larger companies averaged closer to 3 percent of total sales (Fig. 4).
Productivity Metrics
 |
| Fig. 6 |
Companies with fewer than 100 employees outperformed larger companies in three of the four selected metrics related to productivity: capacity utilization, sales per employee, and value added per employee. Meanwhile, larger companies performed slightly better in one metric—value added per labor hour worked.
With respect to capacity utilization for key machines, smaller companies averaged 20 percent while larger companies averaged 18 percent. Performance in the areas of sales and value added per employee was relatively close, with smaller companies outperforming larger ones in these metrics, $185,000 to $178,000 and $96,000 to $94,000, respectively. Large companies had a slightly higher value added per labor hour worked of $55 compared to $54 for smaller companies.
The Bottom Line–Profits
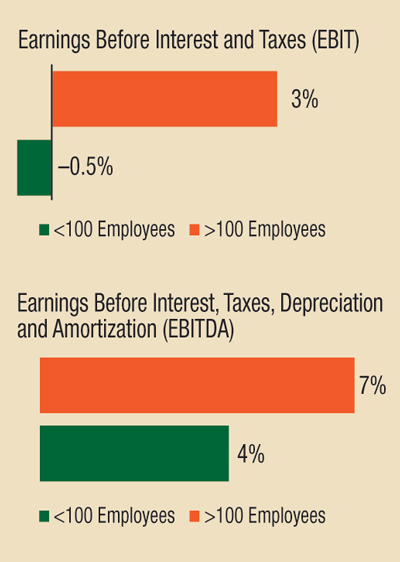
While smaller companies did outperform the larger ones in several operating metrics, larger companies averaged higher profits, which is the one metric where everyone would like to be considered best-in-class.
For EBIT, companies with fewer than 100 employees had an average of -0.50 percent, compared to an average of 3 percent for larger companies. A similar result was seen with EBITDA, where companies with more than 100 employees averaged 7 percent, compared to an average of 4 percent by smaller companies.
So, based on this data, being bigger appears to be an advantage, at least as it relates to the bottom line. However, size alone does not guarantee higher profits. MF Technologies: Management, Training