Robert Dobrowsky Robert Dobrowsky
Partner

The Link Between Total Cost of Quality and Profitability

March 1, 2011
0
Comments


The metalforming industry has been challenged with decreasing revenues and profits. Profitability, as measured by EBIT (earnings before interest and taxes) is at the lowest level, 1.08 percent, since the Precision Metalforming Association’s (PMA) Benchmarking Report started tracking this metric (Fig. 1). During these challenging times, companies are continually looking for s to positively impact profits.
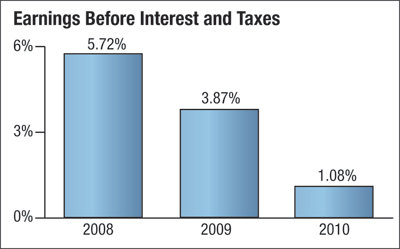
Benchmarking Report
 Fig. 1

Over the last several years, we have studied the results of companies that have participated in this report, looking for patterns and trends to connect operational performance to profitability. The one constant theme that has emerged is that there is no “silver bullet.” Better profitability is not guaranteed just by being best-in-class in any one of the metrics tracked in the report, including employee turnover, internal failure rate or capacity utilization.

Nevertheless, our analysis does show that certain metrics do have a positive correlation with profitability. One example is total cost of quality as a percent of sales, where strong performance appears to be a driver of profitability, or, at the very least, an attribute of profitable companies. Because of its close association to profitability, let’s take a closer look at total cost of quality, how it affects profitability, and how companies use benchmark data to improve.

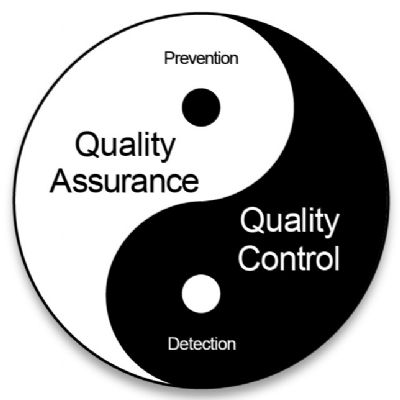
What is Total Cost of Quality?

The PMA Benchmarking report calculates the total cost of quality as a percent of sales by combining the costs for prevention, appraisal, internal failure and external failure, all measured as a percent of sales.

Overall, the metalforming industry has done a good job of driving down total cost of quality. The industry average (see Fig. 2) has steadily declined from a cost of 3.21 percent of sales in 2008 to 2.86 percent in 2010.
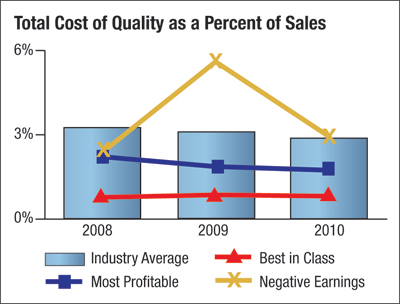
Total cost of Quality as a percent of Sales
Fig. 2 
• Industry Average represents the actual value of the industry average using data from all survey participants.

• Best in Class represents the performance level of the 90th-percentile company without regard to its level of profitability.

• Most Profitable represents the performance of the most profitable companies, the top 10 percent in terms of EBIT.

• Negative Earnings represents the performance of the companies that reported negative EBIT.

The most profitable companies in the report performed better than average, while the companies that lost money generally performed below average, making total cost of quality an important metric for companies to monitor.

The Profitability Affect

Total cost of quality improves profitability in many s: less scrap means a larger bottom line; less sort/rework means employees are spending time where it counts; and, fewer customer complaints give companies more time to spend on proactive initiatives that improve processes, rather than fixing defective processes and firefighting.

According to Mark Netzel, quality assurance manager at Talan Products, Inc., Cleveland, OH, a quality product is the first order of business. It even outweighs making a ship-schedule due date. Bill Adler, CEO of another Cleveland stamper, Stripmatic Products, agrees.

“We’re about 5.5 Sigma right now,” says Adler, “and we’ve greatly reduced our need to inspect parts before they go out the door. This has significantly reduced our indirect labor from where it was 5 yr. ago.”

Improve by Benchmarking

Benchmarking helps companies identify areas for improvement and validate areas that are successful. Talan Products, for example, tracks metrics internally and posts them monthly for all employees to see.

“We use the PMA benchmarks on applicable metrics,” says Netzel. “We have numerous management meetings where we review performance metrics such as efficiency, scrap, availability incidents, customer complaints and performance to budget, as well as a number of business-process metrics (QMS metrics). One example would be our APQP process where we look at first run being 100-percent on time to customer due date, zero quality issues during the first run, and first-run cost performance against quoted numbers.” These are the types of activities that cumulatively contribute to metalformers being more proactive and less reactive.

Not only does reducing the cost of quality positively affect profits, it also impacts employee morale. For example, Adler’s employees respect and acknowledge the importance of making good parts.

“When we do have a quality issue,” he says, “we gather our employees together and explain the impact that the cost of poor quality has on the company. Regular acknowledgement of our quality record has kept everyone’s focus where it belongs—on keeping quality high.” MF

Industry-Related Terms: Run, Scrap
View Glossary of Metalforming Terms

Technologies: Management, Quality Control

Comments

Must be logged in to post a comment.
There are no comments posted.

Subscribe to the Newsletter

Start receiving newsletters.