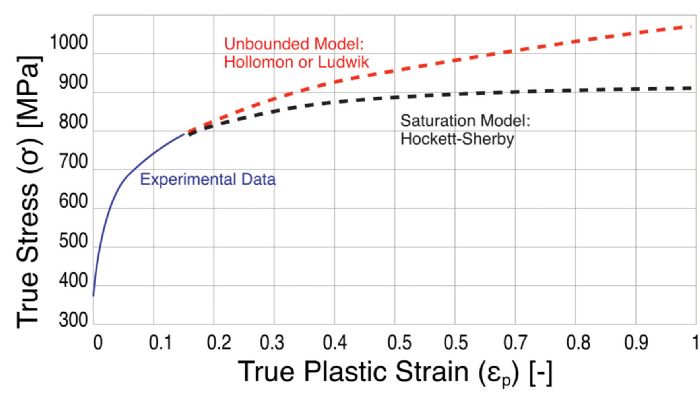
 For a typical automotive sheet metal, the hardening curve (Fig. 1d) can be determined only until 0.15 true plastic strain. For deep-draw-quality steels, the maximum true plastic strain can slightly exceed 0.25. Most software, however, requires this data until 1.0 true plastic strain. The most common method to achieve this: Extrapolate the data by fitting an equation to the data you know, and trying to predict how the true stress may evolve at high (true plastic) strains.
Material Models
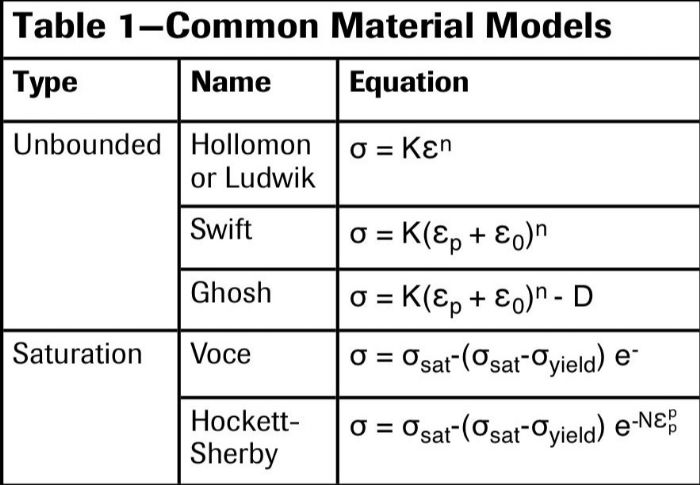 Two main classes of material models exist: unbounded and saturation models. Generally, we use unbounded models for most steels and saturation models for aluminum. Unbounded models, unlike saturation models, feature a strain-hardening exponent “n” (Table 1). You may have heard that n is not constant for aluminum, or that aluminum cannot have a single n-value for aluminum. Also, advanced high-strength steel (AHSS) grades do not have a constant n-value.
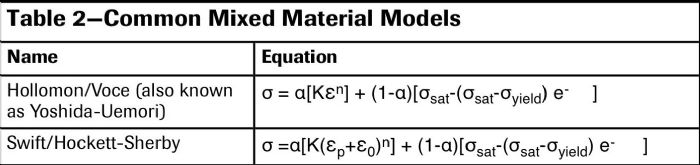
More recently, mixed models have gained use for steels and aluminum alloys. These mixed models typically contain a ratio factor (shown by αα or µ). Commonly used mixed models include Hollomon/Voce and Swift/Hockett-Sherby, with the former as the default hardening-curve model for the Yoshida-Uemori material model used in advanced springback prediction.
 How to decide on a model? Use unbounded for low-strength steels, saturation for aluminum and mixed models for AHSS, or check all models to see which fits best. In any case, different models may yield huge variations at true plastic strain of 1. Fig. 2 shows almost a 20-percent difference between two material models. With no further information, a user may not be sure of springback results nor press-force estimations.
How to Create the Hardening Curve?
First, try to reduce the need for extrapolation as much as possible. If the material to be tested starts necking at around 0.20 true plastic strain, how can we gain more true-strain data? Two methods: Use either a biaxial test—such as the hydraulic bulge test—or a digital image correlation (DIC) system.
 A hydraulic bulge test involves clamping a square sheet of 200 by 200-mm square sheet of material with a lock bead, and hydraulic pressure introduced to freely bulge the material. During the test, digital images provide for strain measurements/calculations with pressure recorded for stress calculations. The minimum necking strain in a bulge test measures 0.36, and with increased strain hardening (n-value), the necking strain increases. This can reduce the need for extrapolation, as reported by many researchers. Use caution when using the hydraulic bulge test on tough materials such as new-generation AHSS. These material sheets, with high elongation together with high strength, may burst at high-enough internal pressure and release great amounts of energy.
Using a 2D DIC system can help determine the true stress-true strain curve after diffuse necking in a tensile test. Once the local necking starts, the thickness of the sheet also significantly reduces (see Cutting Edge column in MetalForming’s February 2020 issue). Users also can determine the true stress-true strain curve all the way to fracture by using a 3D DIC system.
Best-Practice Idea
 Even using a 3D DIC system may not deliver a hardening curve to 1.0 true plastic strain. We have recently developed a computer code that fits all of the hardening-curve models listed in Tables 1 and 2. The extrapolation ends at 1.0 true plastic strain and checks for the median value. Then, the minimum and maximum values are recorded to determine the error margin. Furthermore, the code provides filtered raw data until the end of experimental data—in our case, the beginning of the local neck—and then continues extrapolating with (almost) no interruption.
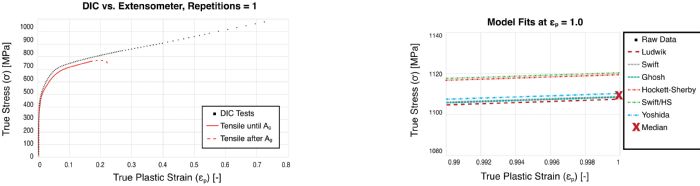
Fig. 4 shows DP590 tensile-test data with and without DIC. The DIC data then fit in the Table 1 and 2 equations. With the developed method, for DP590 steel, the true stress at 1.0 true plastic strain was estimated at 1112 MPa with an error margin of less than 1 percent (between 1108 and 1122 MPa). MF
See also: Billur Metal Form
Technologies: Materials


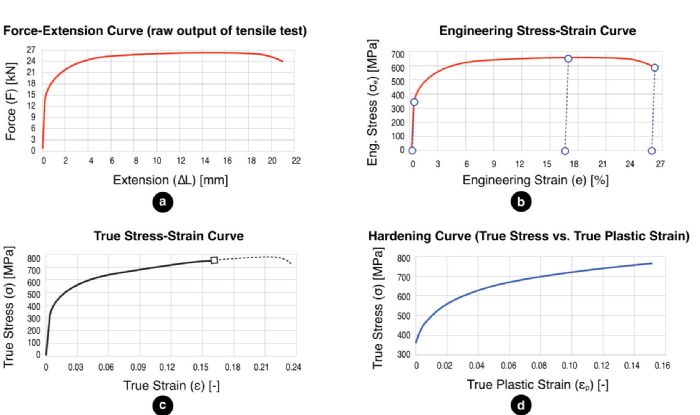 A tensile test involves recording force and extension values (Fig. 1a), with this data then converted to an engineering stress-strain curve by dividing the force by the initial cross-section area and the extension by the original gauge length. Most of the material specifications (elastic modulus, yield stress, universal tensile strength, uniform and total elongation) are defined on the curve as shown in Fig. 1b (see recent Metal Matters columns in MetalForming for detailed explanations of these specifications).
 Webinar