


Metal Properties: Tensile Strength
September 26, 2022Comments
Note: This article continues a series on metal properties: Elastic Modulus, August 2022 issue of MetalForming; and Yield Strength, September 2022 issue of MetalForming.
Determining material strength during a tensile test requires dividing the pulling load by the cross-sectional area of the tensile bar, leading to the units of lb./in.2. Impacting the results are whether the calculation incorporates the tensile-bar width and thickness before testing begins, or whether the calculations consider the ever-changing dimensions instead.
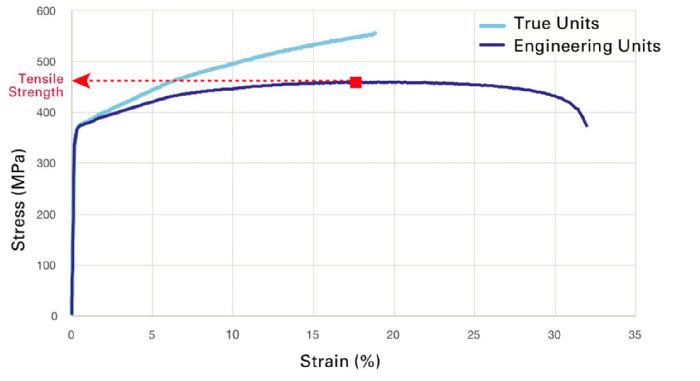 Using the initial dimensions of the tensile bar creates the engineering stress-strain curve. The material provider bases the material’s properties, provided on the metal certifications, on engineering units. Because the initial cross-sectional area is a constant, any changes in stress reflect changes in the load required to deform the tensile specimen. This stress-strain curve has a characteristic parabolic shape, with the maximum strength defined as the ultimate tensile strength (UTS, TS or Rm). After reaching the tensile strength, the curve shape might suggest that the metal softens. However, it does not, with other aspects of the test at play to explain the downward-sloping shape.
While using the initial dimensions of the tensile bar is convenient, it does not reflect what occurs during the test. A tensile load elongates the test sample, with both the thickness and width decreasing. Remembering that metal alloys gain strength with additional deformation from work hardening, the applied load continues to increase. With the cross-sectional area continually decreasing as the test progresses, strength (load divided by the instantaneous cross-sectional area) continues to rise. Using the ever-changing dimensions of the tensile bar creates the true stress-strain curve. Properties incorporated into metal forming simulations are based on true units, accounting for dimensional changes occurring with deformation.